Business Intelligence Reports
Build connected business reports that update periodically and turn operational data into clear dashboards, KPIs, and executive views.
About It
Business data can be connected, cleaned, structured, and transformed into reports that update periodically instead of being rebuilt manually every week or month.
These reports help teams monitor KPIs, detect changes, compare performance, and present business information through dashboards, executive views, or recurring management reports.
When useful, an AI layer can be added to generate executive summaries, explain relevant changes, and highlight risks or opportunities based on the latest validated data.
- Connected and periodically updated reports
- Clear visibility of KPIs and business trends
- Reduced manual reporting work
- Optional AI-assisted executive summaries
How It Works
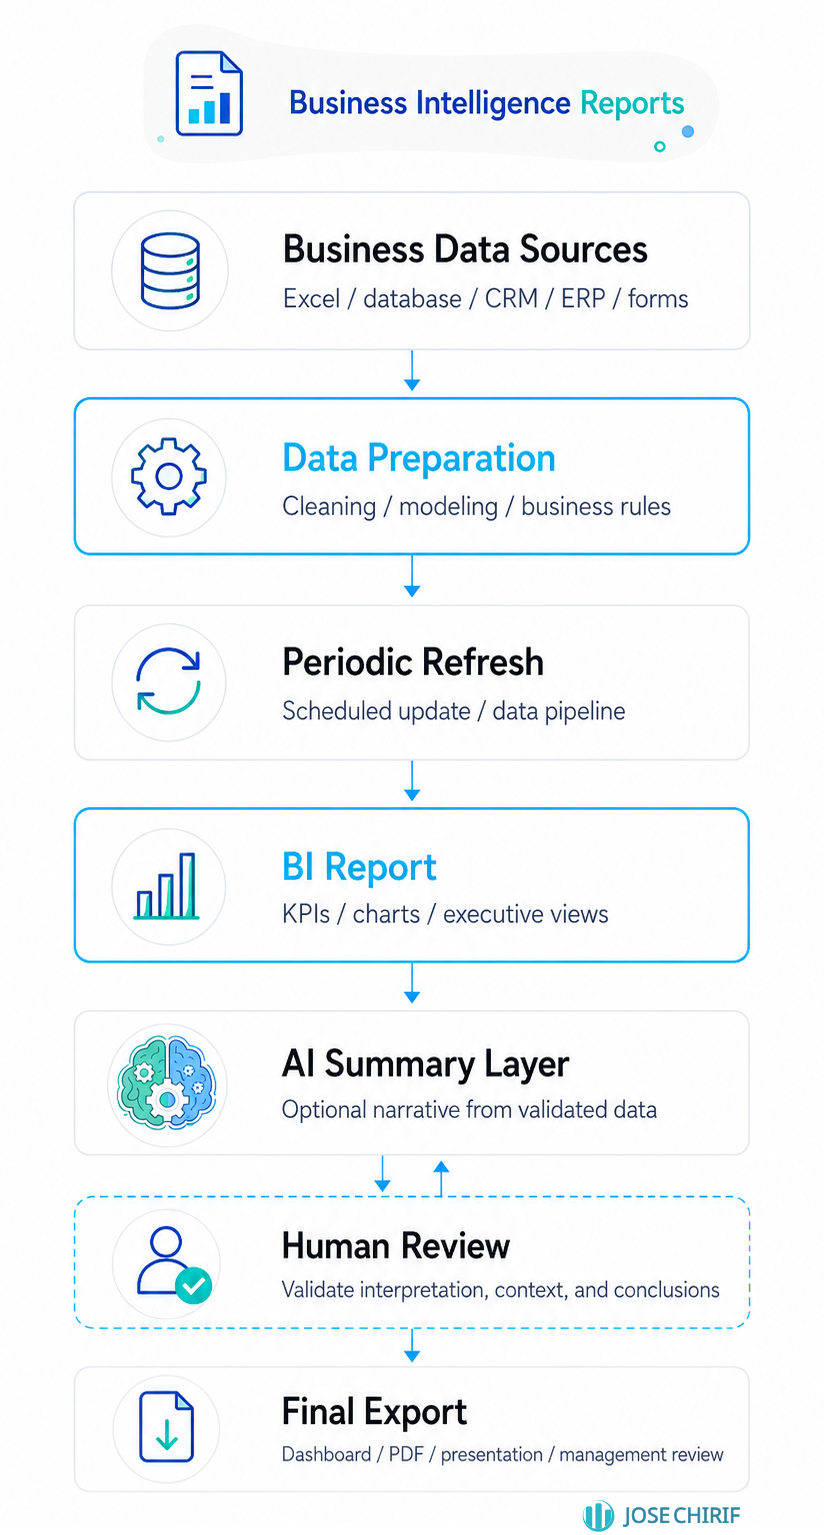
Business data is connected from selected sources, cleaned and structured using reporting rules, then refreshed periodically to keep dashboards and reports updated.
Key indicators are presented through BI views, charts, and executive report sections. When needed, an optional AI layer can generate summaries from the latest validated data, while human validation ensures that important interpretations, conclusions, and business decisions are reviewed before final use.
Service Scope
The service focuses on building connected BI reports that transform business data into updated dashboards, KPIs, and executive views.
- Review of current reporting needs and business indicators
- Definition of KPIs, report structure, and update frequency
- Connection to structured data sources such as Excel, Google Sheets, databases, forms, CRM, or ERP exports
- Data cleaning, transformation, and preparation for reporting
- Dashboard or report view with charts, tables, filters, and business metrics
- Periodic refresh setup according to the reporting cycle
- Important metrics, interpretations, and conclusions are reviewed by a person before they are used for business decisions or shared with stakeholders
Use Cases
Designed for teams that need recurring visibility of business performance without rebuilding reports manually every period.
Including:
- Monthly management dashboards
- Sales and commercial performance reports
- Operational KPI monitoring
- Financial or administrative summaries
- Client-facing progress reports
- Executive presentations with updated indicators
Responsible Use
- Reports should be based on validated and traceable data sources
- Data quality directly affects the reliability of KPIs and insights
- Business rules and calculations should be reviewed before deployment
- AI-generated summaries should be reviewed before being shared
- Critical financial, legal, or strategic conclusions require human validation
- The system supports decision-making; it does not replace business judgment
Get Your BI Report
Describe your reporting process, and I can propose an automated BI workflow that turns raw data into clear business insights.